Lucid Hedge:
Smarter Options Analytics
Unlock actionable insights, visualize volatility, and optimize your options strategies with our advanced analytics platform for traders and investors.
Visit Dashboard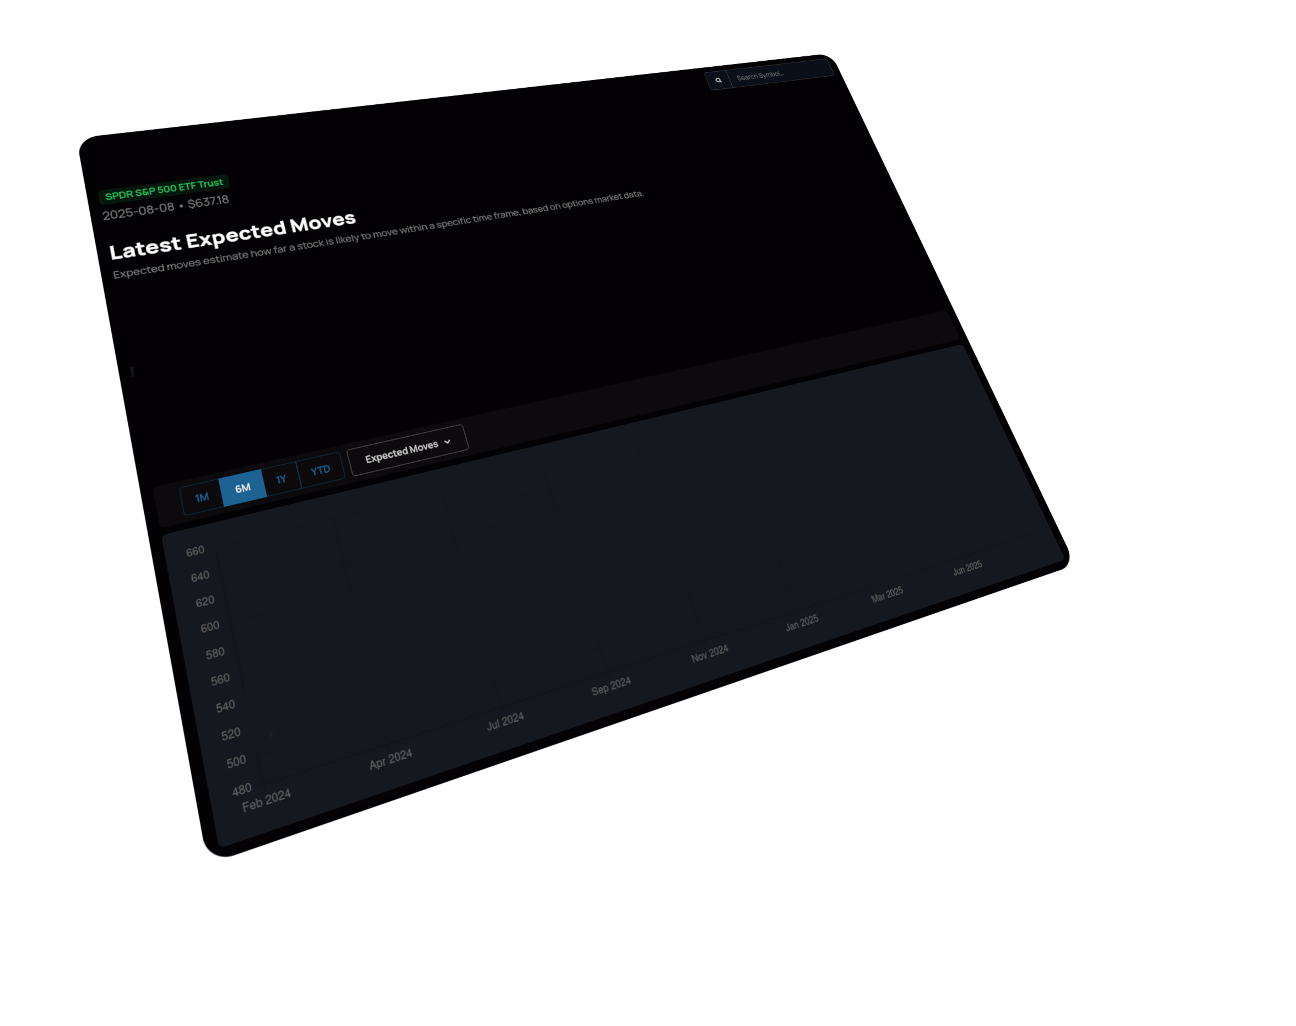

Options Analytics Platform Features
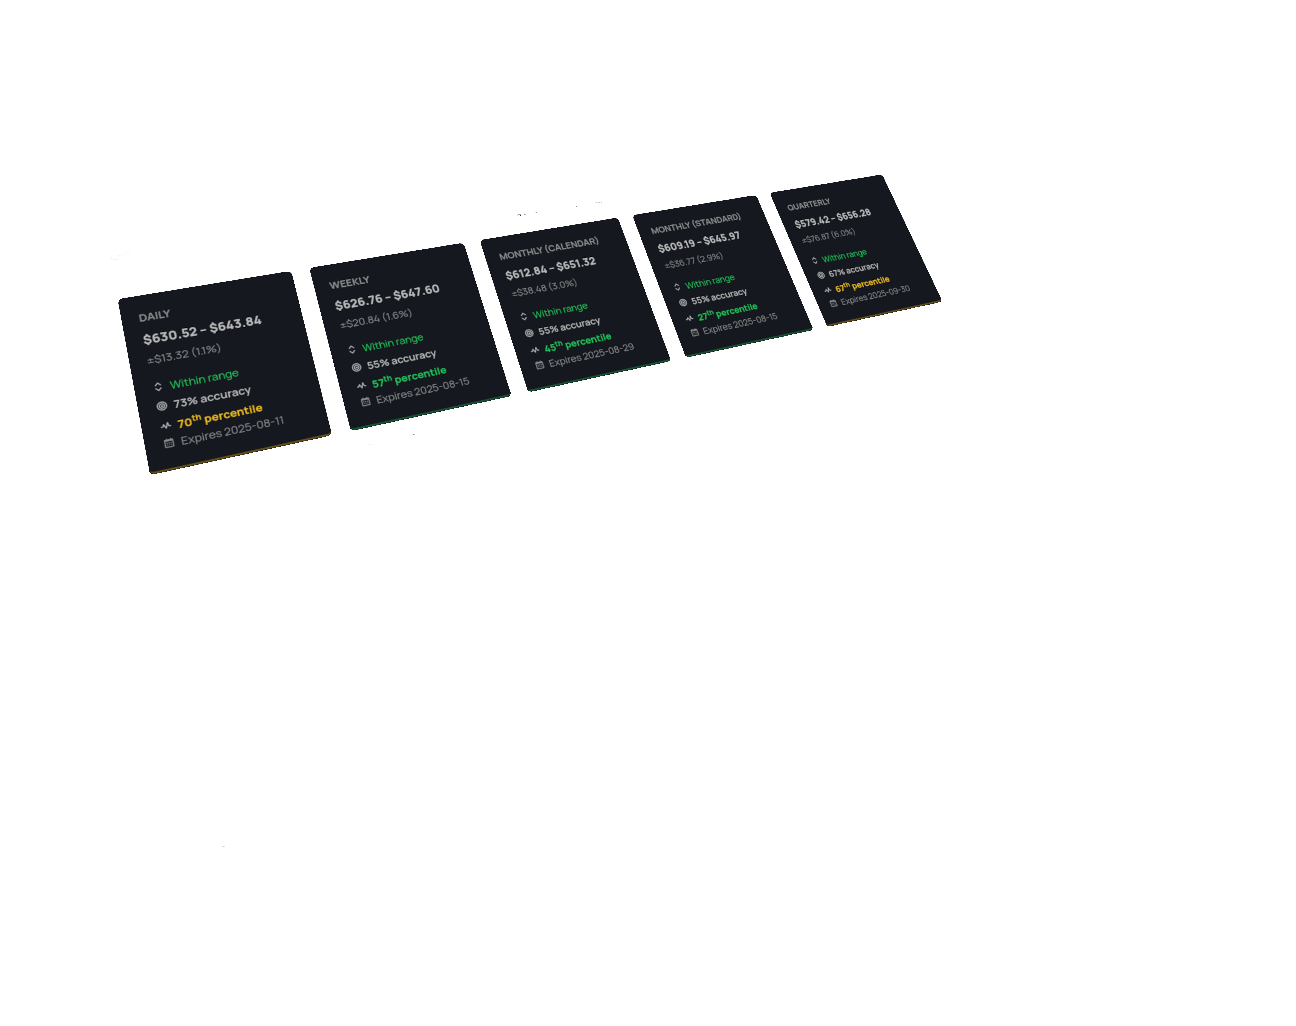
Expected Moves
See option-implied move ranges for stocks and ETFs, updated daily for all major tickers.
Expected Move History
Visualize how expected moves have evolved over time for any stock or ETF, with historical accuracy and percentile ranks.
Volatility Measurements
Track volatility using historical expected moves, compare current risk to past market regimes.
Net Gamma & Delta
Analyze net gamma and delta exposure for stocks and options to understand dealer positioning and hedging flows.
Gamma Exposure Map
Explore gamma exposure by strike and expiration date to identify key hedging levels and market dynamics.
Market Overview
Get a summary of expected moves for 800+ stocks to see how the market is handicapping risk and volatility.
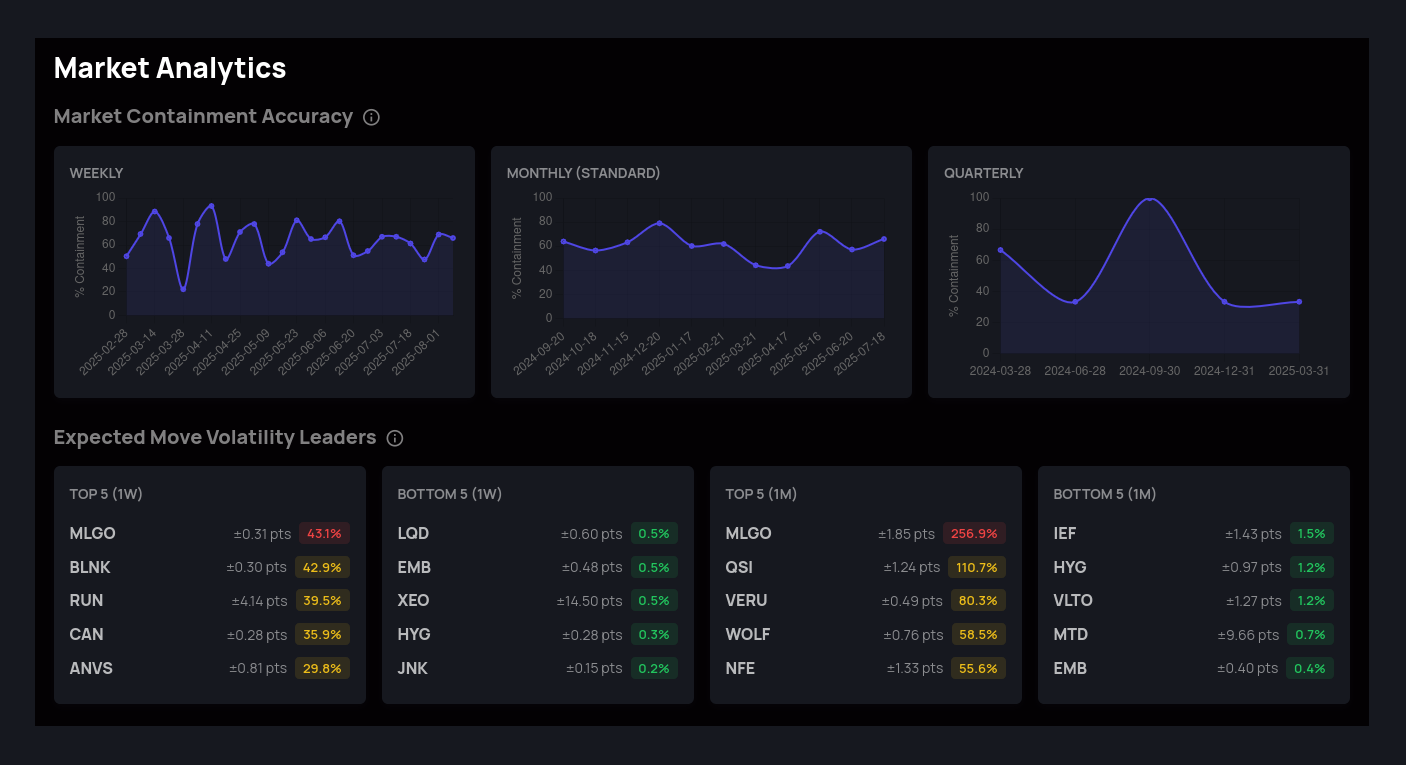
Market Analytics
Explore market containment accuracy, expected move volatility leaders, and historical trends for stocks and ETFs. Track how option-implied ranges and volatility shift across weekly, monthly, and quarterly cycles. See which symbols lead in volatility and how current risk compares to past market regimes.
Visit DashboardOptions Analytics for Every Trader
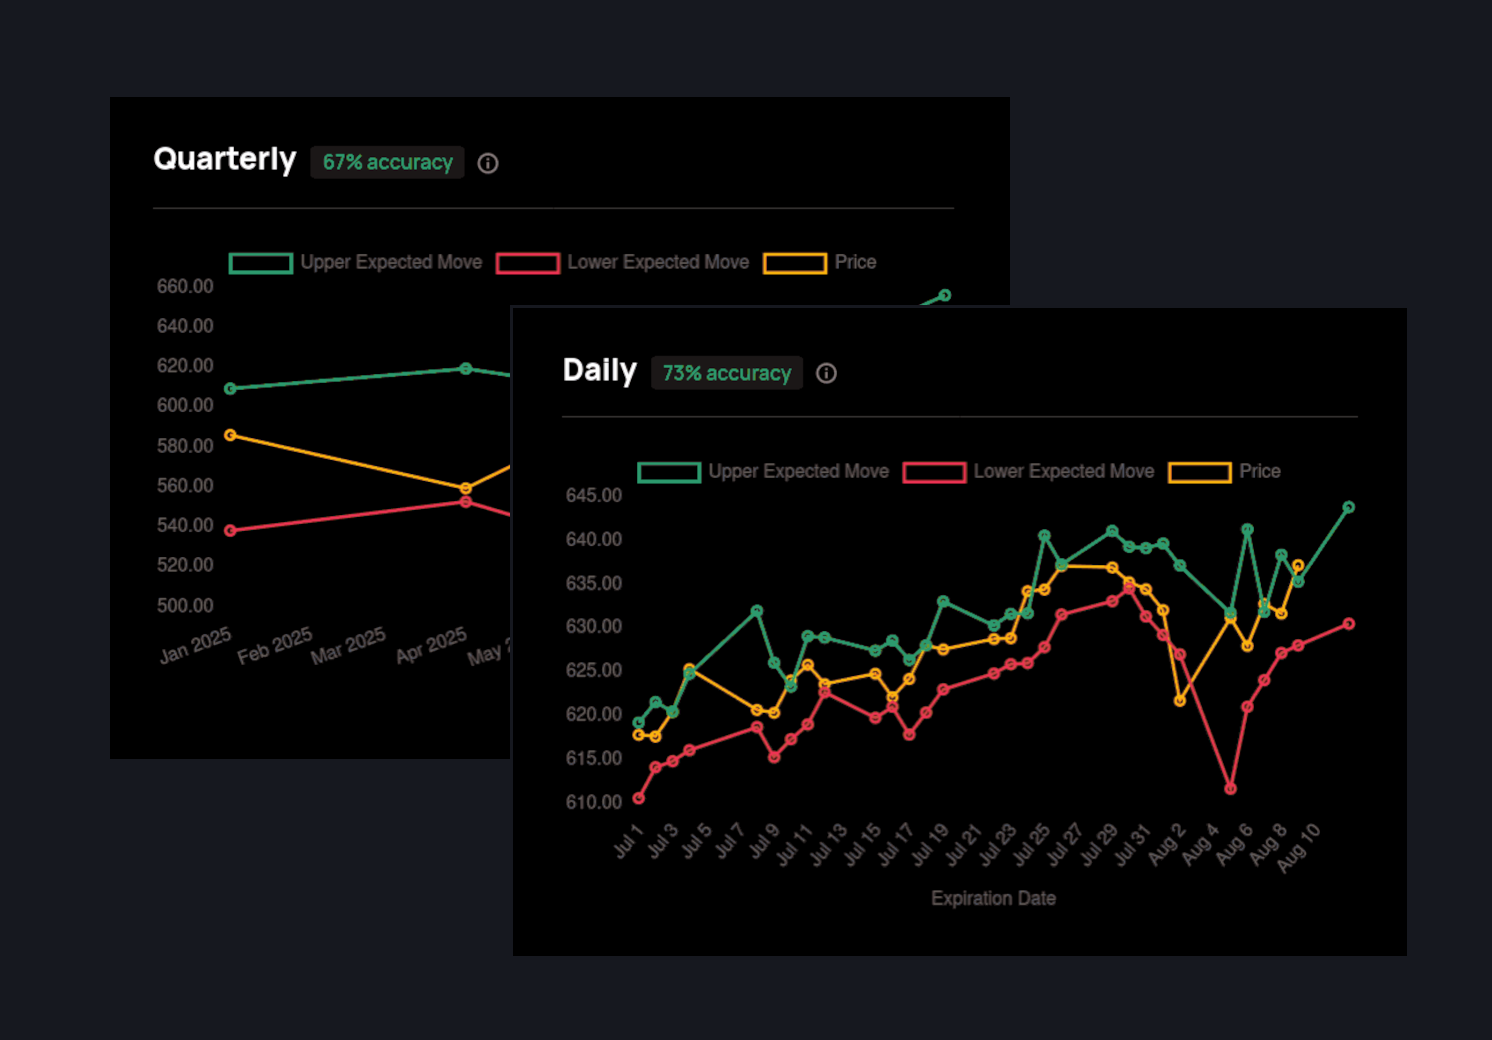
Expected Move History
Visualize how expected move ranges have evolved for stocks and ETFs using real options data. Track daily, weekly, monthly (standard and end-of-month), and quarterly expiration cycles. See historical accuracy and percentile ranks.
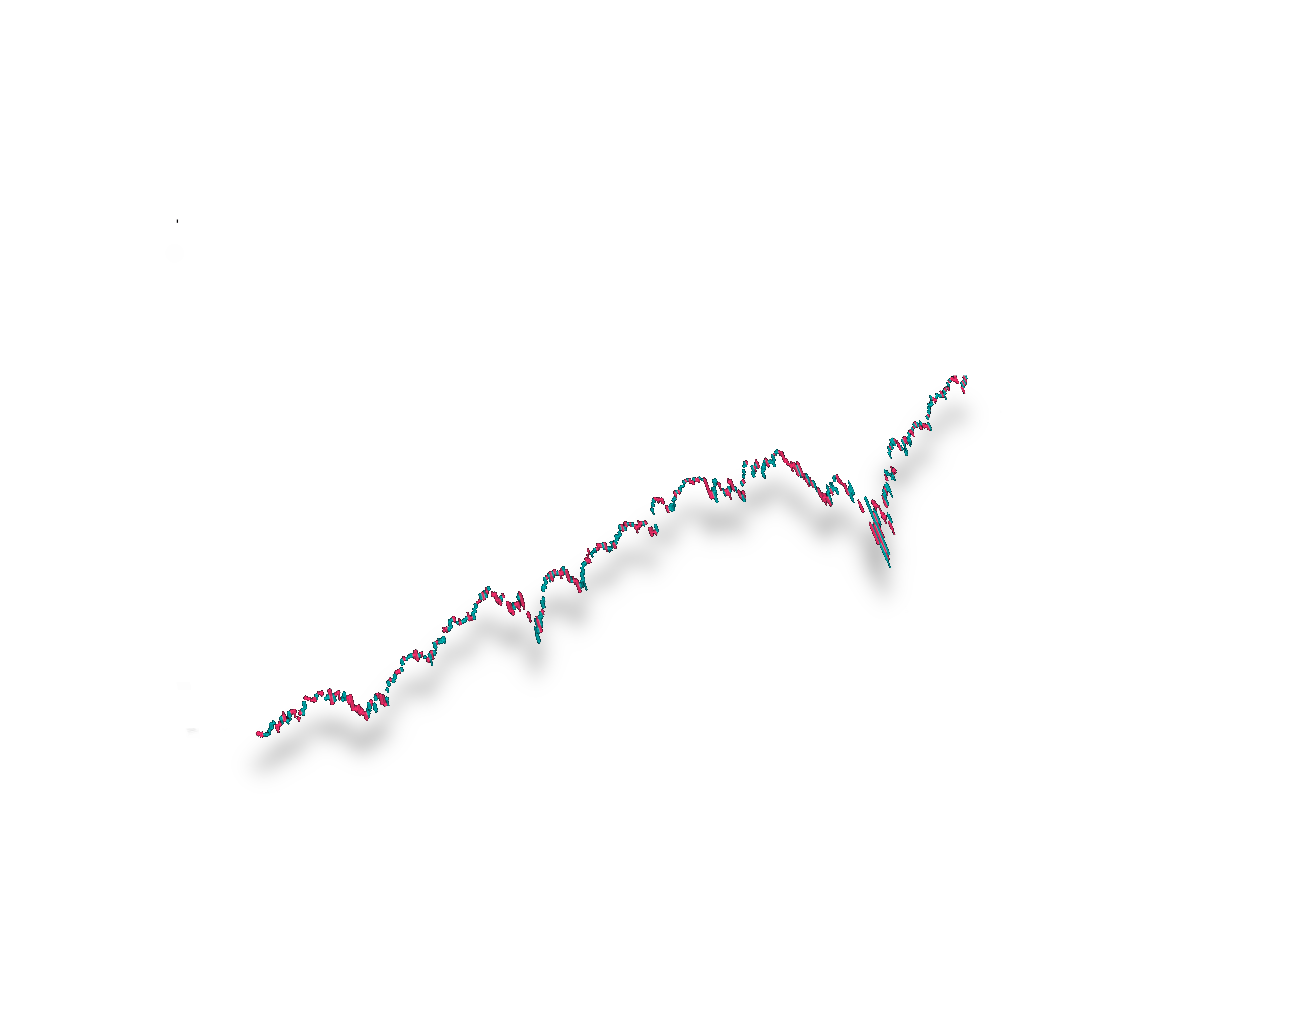
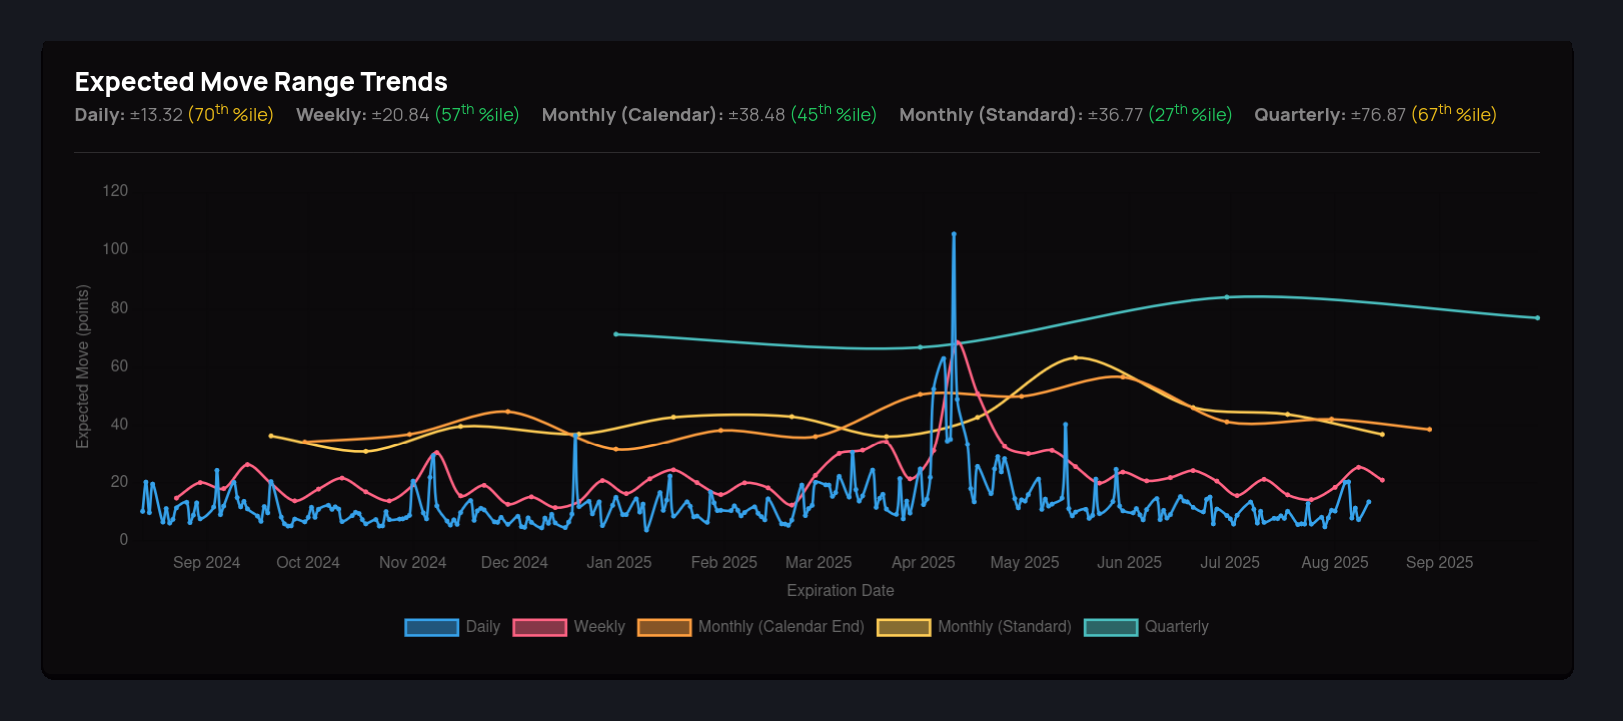
Expected Move Volatility Trends
See how the expected move for stocks changes over time, visualized as a trend graph. This feature helps you understand shifts in market volatility and how option-implied moves compare across different periods, giving you a clearer picture of risk and opportunity.
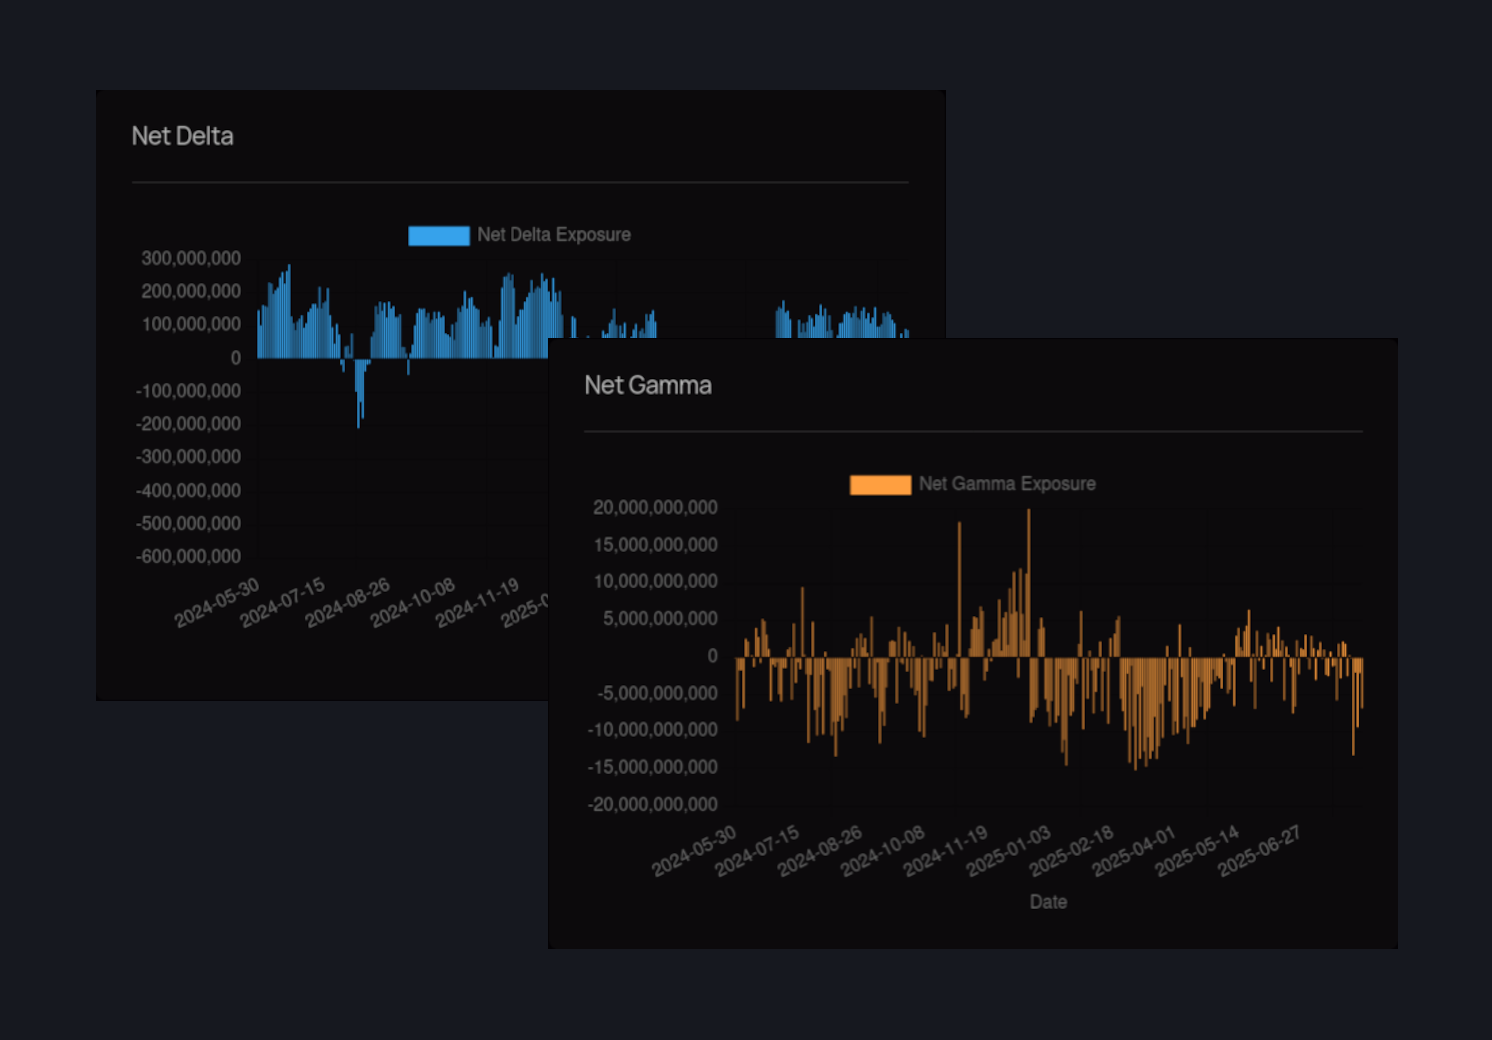
Net Gamma/Delta
Visualize the combined net gamma and delta exposure for stocks and options. This chart helps you understand how dealer positioning and hedging flows may impact price movement, liquidity, and volatility in the market.
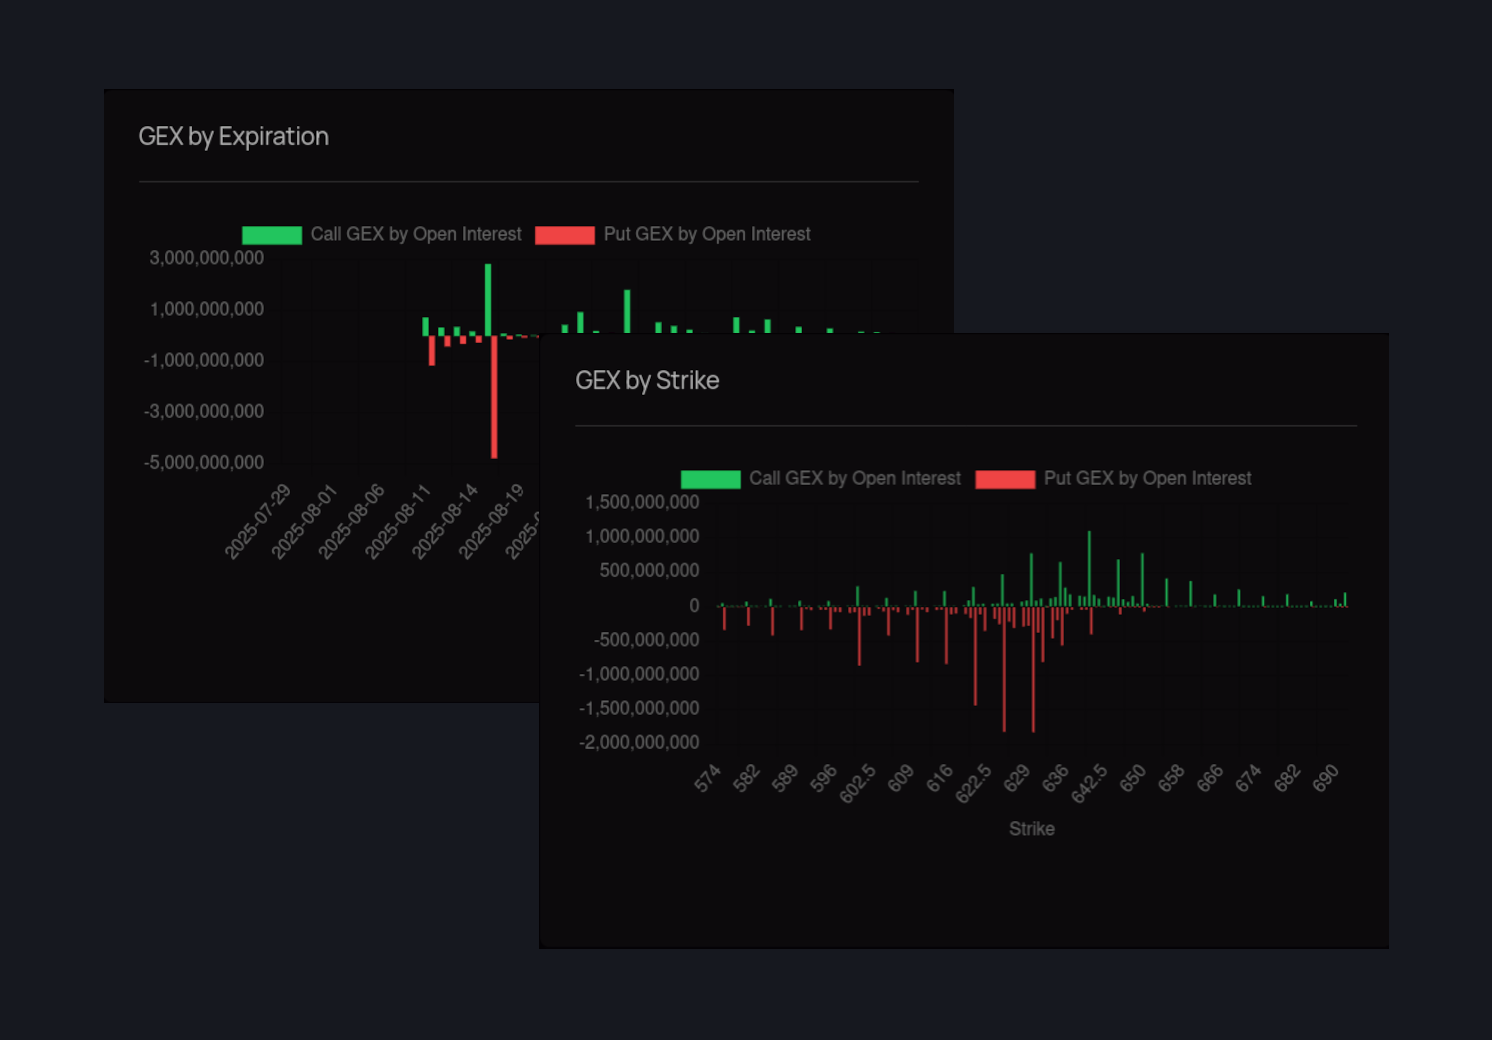
Gamma Exposure
Explore gamma exposure across strikes and expiration dates. This visualization helps you identify key levels where options dealers may need to hedge, revealing potential areas of market support, resistance, and volatility shifts.
Limited-Time Offer: Lifetime Pricing
Secure a special discounted rate for the lifetime of your subscription. As a founding user, your valuable feedback is crucial as we refine the platform and work out any initial kinks.
Special Beta Pricing
$49.99 $12.50
$39.99
/ per month
- Historical and Upcoming Expected Moves
- Gamma Exposure
- Net Gamma & Delta
- 100s of stocks & ETFs
- Seasonality (coming soon)